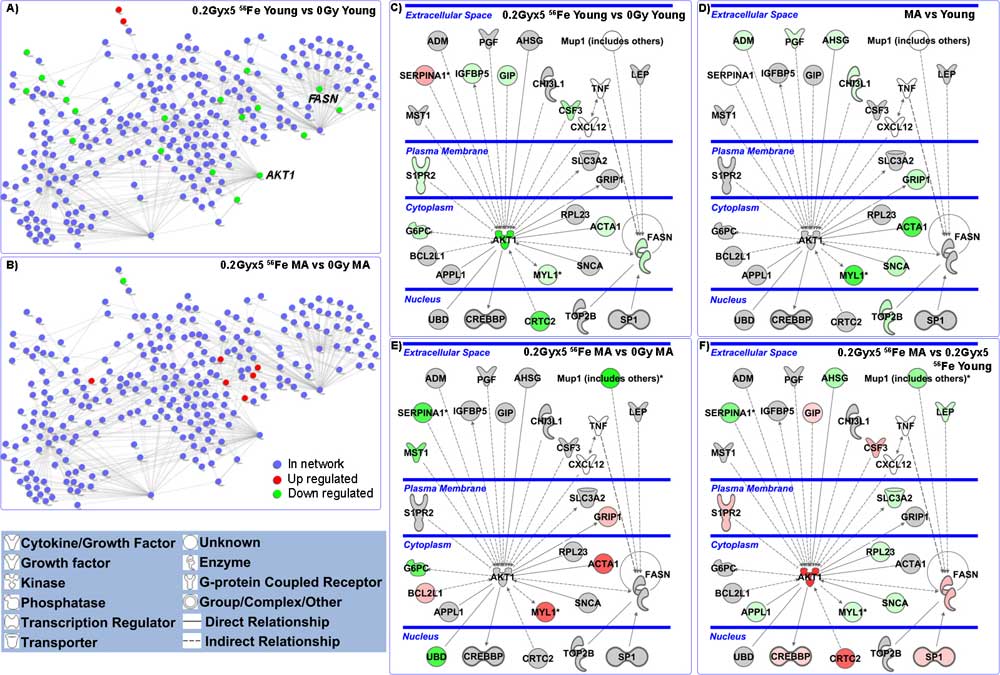
 Figure 3. A murine protein-protein interaction (PPI) network
for signaling proteins assessed from the regulation of gene
expressions. For A) & B) the
network contains 281 murine proteins linked by 551 unique
interactions. Blue nodes represent
proteins that are in the network but are not regulated by the
56Fe irradiation perturbation, red nodes are determined to be up-regulated,
and green nodes are
down-regulated. A) PPI network showing
regulations of tumors growing in young 56Fe-irradiated
mice as compared with those in young unirradiated
mice. B) PPI network regulations in tumors
growing in middle-age 56Fe-irradiated mice compared
with those in middle-aged unirradiated mice. For
(C) – (F) pathway analysis
was done with Ingenuity Pathway Analysis (IPA) software. Network
depicted contains central nodes from AKT1 and FASN with direct
(— solid lines) and indirect (- - dashed lines)
relations to these molecules. Log2 fold changes to the
gene expression were used to obtain different shades of green for regulation levels for
down-regulated genes, while different shades of red depict regulation levels for up-regulated
genes. Grey genes exist in the network
without a significant 2-fold change under the perturbation
investigated. The darker the shade of green or red, the greater
the fold change.
Figure 3. A murine protein-protein interaction (PPI) network
for signaling proteins assessed from the regulation of gene
expressions. For A) & B) the
network contains 281 murine proteins linked by 551 unique
interactions. Blue nodes represent
proteins that are in the network but are not regulated by the
56Fe irradiation perturbation, red nodes are determined to be up-regulated,
and green nodes are
down-regulated. A) PPI network showing
regulations of tumors growing in young 56Fe-irradiated
mice as compared with those in young unirradiated
mice. B) PPI network regulations in tumors
growing in middle-age 56Fe-irradiated mice compared
with those in middle-aged unirradiated mice. For
(C) – (F) pathway analysis
was done with Ingenuity Pathway Analysis (IPA) software. Network
depicted contains central nodes from AKT1 and FASN with direct
(— solid lines) and indirect (- - dashed lines)
relations to these molecules. Log2 fold changes to the
gene expression were used to obtain different shades of green for regulation levels for
down-regulated genes, while different shades of red depict regulation levels for up-regulated
genes. Grey genes exist in the network
without a significant 2-fold change under the perturbation
investigated. The darker the shade of green or red, the greater
the fold change.
Reference: Age and space irradiation modulate tumor
progression: implications for carcinogenesis risk. Beheshti
A, Sachs RK, Peluso M, Rietman E, Hahnfeldt P, Hlatky
L. Radiat Res. 2013 Feb;179(2):208-20. Epub 2013 Jan 4.]
Close this window (or tab) to return to the Center of Cancer Systems
Biology at GRI/Tufts website.