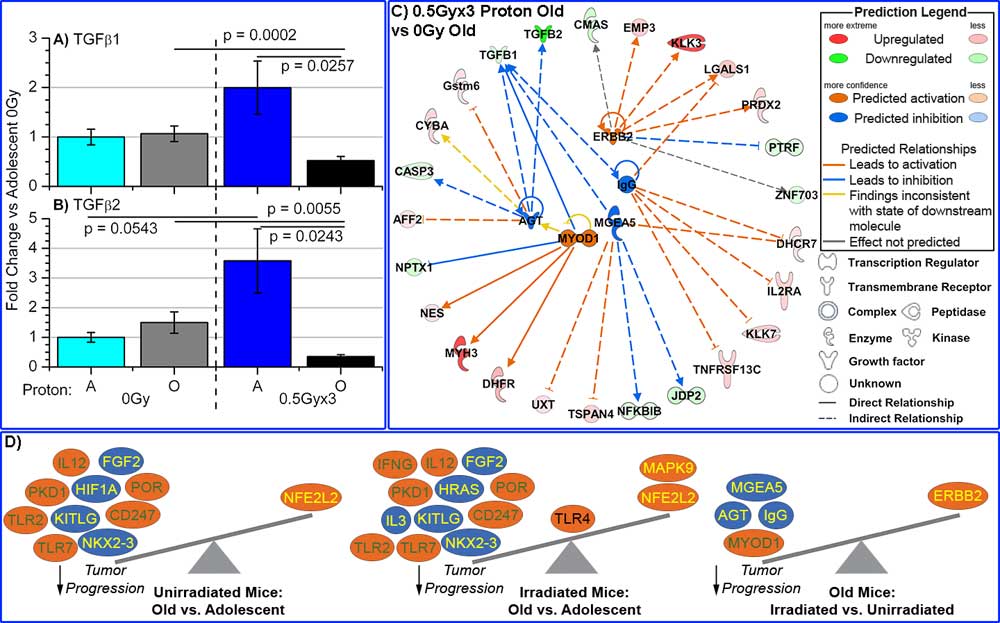
Figure 2. Characterization of TGFβ1 and TGFβ2 in
tumors from proton irradiated and unirradiated adolescent and old
mice. The mRNA expression for A) TGFβ1 and for B)
TGFβ2, was determined by real-time PCR (RTPCR). Fold changes
for mRNA expression were determined for each group, compared to
0Gy adolescent mice. Significance is indicated by the p-values
within the plots. C) Gene network depiction of upstream regulators
predicted to be either activated (orange) or inhibited (blue) in tumors from irradiated old mice
versus from unirradiated old mice, determined by IPA
software. Specific up-regulated (red) and
down-regulated (green) genes from the
experimental data set involved in determining the activation state
of the upstream regulator are shown with direct (—solid lines) and
indirect (- - dashed lines) relationships to the upstream regulators.
The predicted relationships are color coded to indicate whether it
leads to activation (orange) or
inhibition (blue). Relationships
that are inconsistent with the prediction (yellow) or have an
undetermined effect (grey) are also
shown. The darker the shade of green or red, the greater the fold
change. D) A schematic of the activation states of the upstream
regulators illustrating the balance between the tumor
promoters (text in yellow) and tumor
suppressors (text in green)
with a predicted activation (orange oval) or predicted inhibition
(blue oval).
Reference: Proton Irradiation Augments the Reduction in Tumor
Progression Observed With Advanced Age. Beheshti A, Peluso M,
Lamont C, Hahnfeldt P, and Hlatky L. Accepted Radiation Research
in press, 2014.
Close this window (or tab) to return to the Center of Cancer Systems Biology at GRI/Tufts website.